2018 Employee Recognition Report
Recognize Team surveyed over 1,000 employees across industry, pay-scale, gender, and age on their employee recognition and rewards preferences. More updates in the works with participant-segmented insights.
For 2019, we analyzed the 2018 data from three Recognize studies and combined them into one meta-analysis on the differences between age, job title, and gender in regards to employee recognition preferences.
Scroll to results Contact Us to Download reportMajor takeaways from the Employee Recognition Report
- Cash is still king, merchandise is out
- 49% of people have left jobs for not being recognized
- People want regular recognition mostly quarterly, yearly, or monthly
- 76% of people aren't interested in micro-bonuses
- People prefer work anniversaries over birthdays at work
- People are generally comfortable with online recognition


Get Employee Recognition Report
Download the PDF of the results from this webpage.
Contact Us to Get report
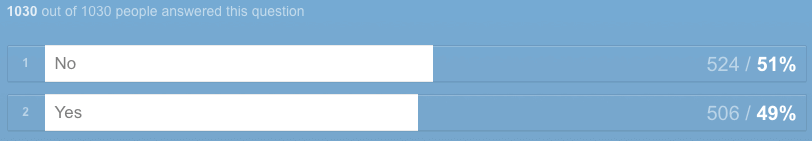
49% of employees surveyed quit a job for not receiving employee recognition
Q: Have you ever left a job because you felt under-appreciated?
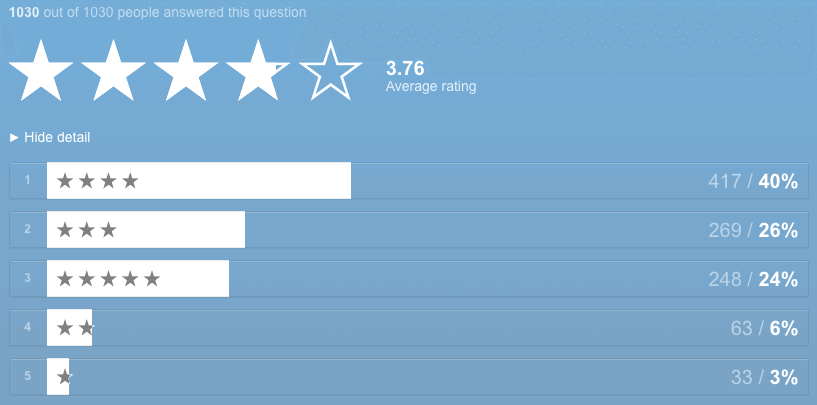
Most employees are generally happy with their jobs
Q: In general, how satisfied are you with your current workplace?
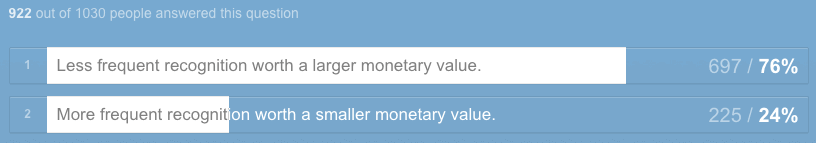
76% of employees prefer less frequent employee recognition with higher value
Q: Which type of recognition do you prefer?
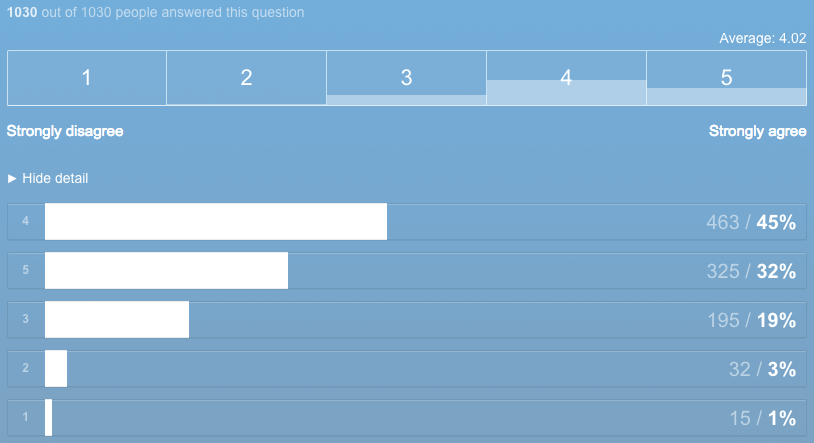
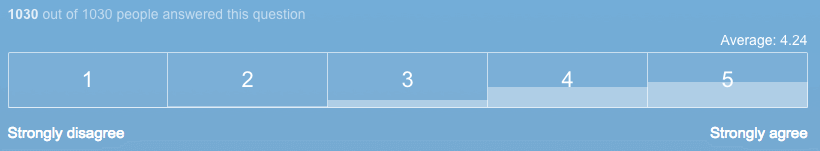
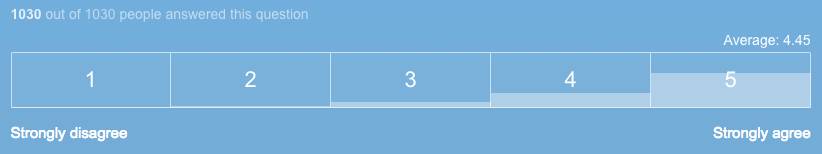
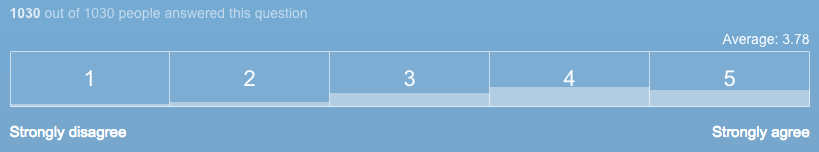
Most employees appreciate being appreciated
Q: I appreciate being recognized by my peers for my contributions in the workplace.
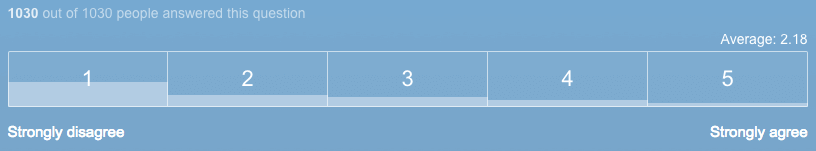
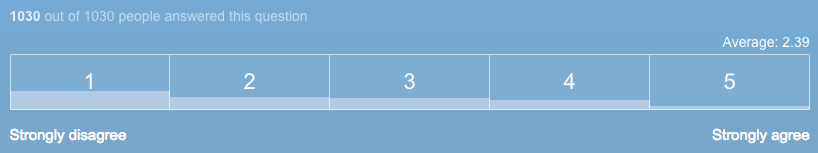
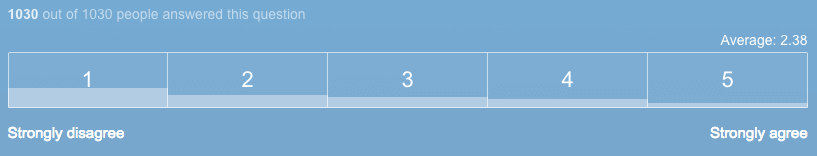
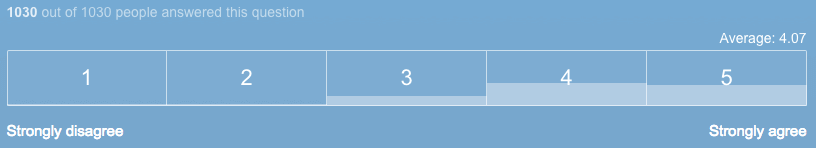
Employees prefer private employee recognition from their managers
Q: I appreciate being publicly recognized by my company for my contributions.
Q: I appreciate being privately recognized by my company for my contributions.
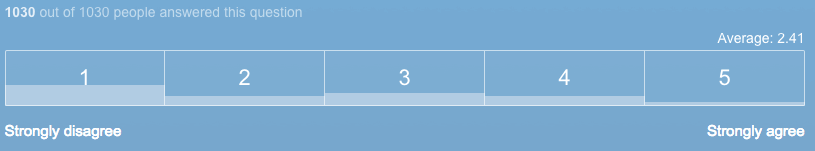
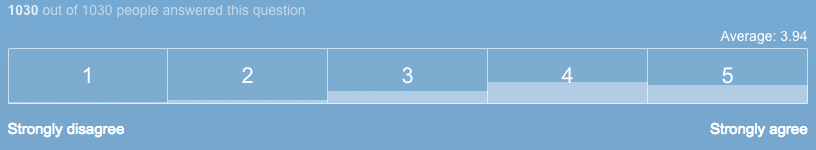
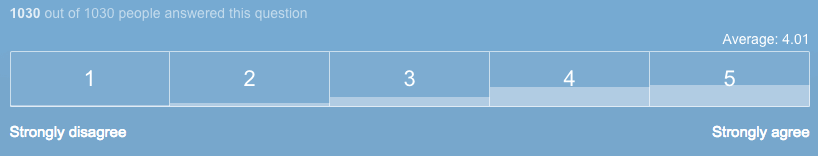
Employees prefer private birthday recognition
Q: I like when my company publicly recognizes my birthday.
Q: I like when my company privately recognizes my birthday.
If employees had to choose, they would prefer work anniversaries than birthday celebrations.
Q: I like when my company publicly recognizes my work anniversary.
Q: I like when my company privately recognizes my work anniversary.
Employees love cash as a result of employee recognition
Q: When receiving recognition at my company, I prefer cash rewards.
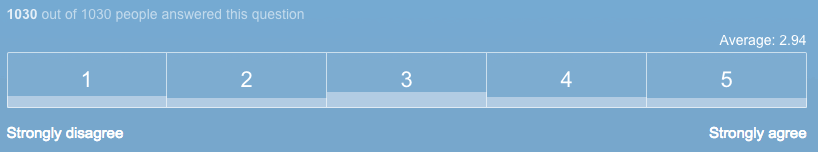
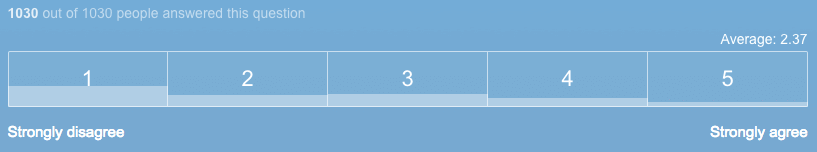
Donation to charity is not preferred
Q: When receiving recognition at my company, I prefer donating to the charity of my choice.
Employees want paid time off as an employee recognition reward
Q: When receiving recognition at my company, I prefer additional paid time off.
Employees are least interested in a parking spot of the choices we asked
Q: When receiving recognition at my company, I prefer a special parking spot.
Merchandise is out for employee recognition
Q: When receiving recognition at my company, I prefer merchandise.
Most employees are not interested in experiences as employee recognition rewards either
Q: When receiving recognition at my company, I prefer experiences, such as a massage or sky dive trip
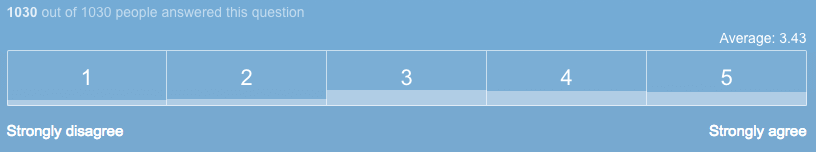
Employees feel similarly about plaques as they do about experiences.
Q: When receiving recognition at my company, I prefer receiving a plaque or award certificate.
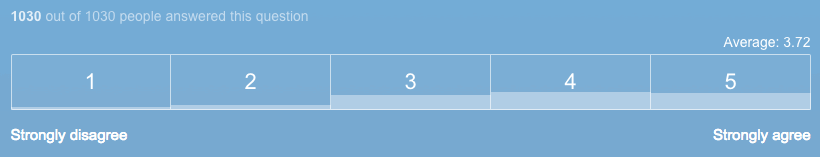
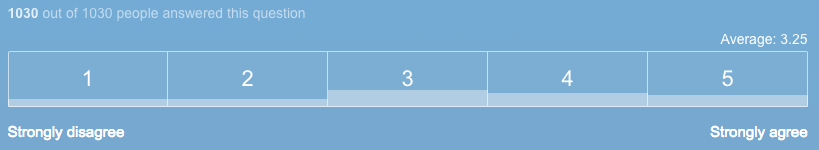
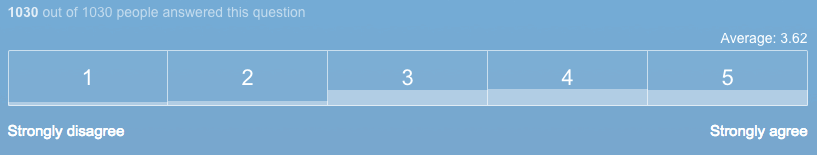
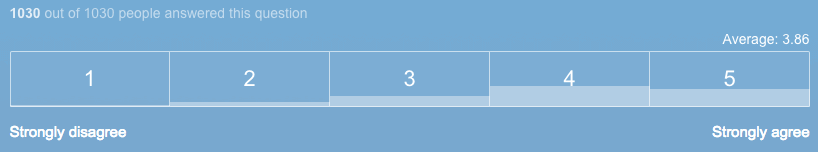
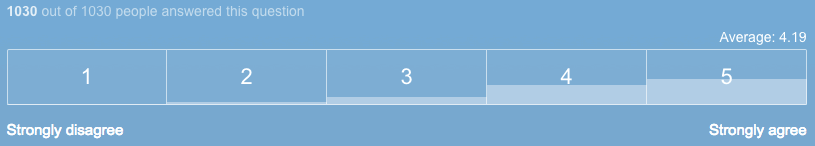
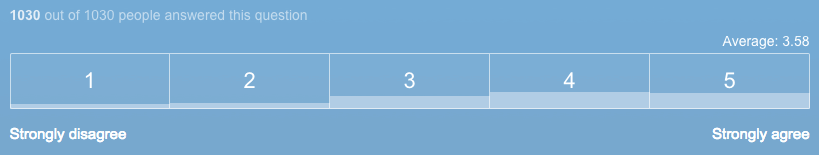
Employees self-report a similar motivation when recognized by peers, managers, or executives
Q: I feel motivated in my work when I am recognized by my manager.
Q: I feel motivated in my work when I am recognized by my peers.
Q: I feel motivated in my work when I am recognized by my company's executives.
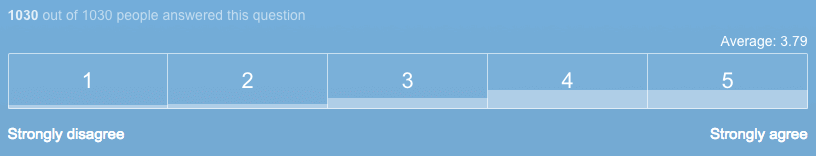
Employees slightly prefer recognizing peers in private
Q: I feel comfortable recognizing peers for their contributions in a public group setting.
Q: I feel comfortable recognizing peers for their contributions privately in person.
Employees slightly prefer recognizing peers in person than online
Q: I feel comfortable recognizing peers for their contributions publicly through an online form.
Q: I feel comfortable recognizing peers for their contributions privately through an online form.
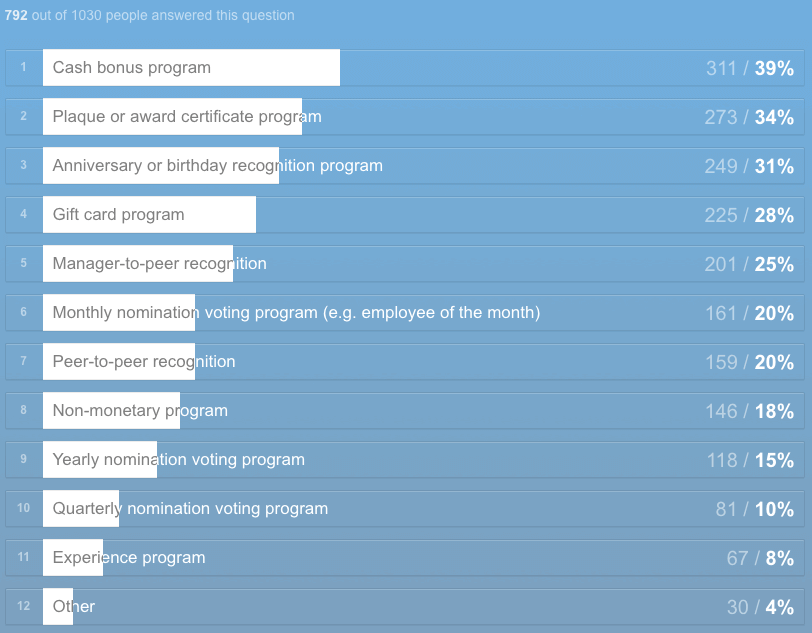
35% of employees have never experienced an employee recognition program
Q: Have you ever worked for a company with an official employee recognition program?
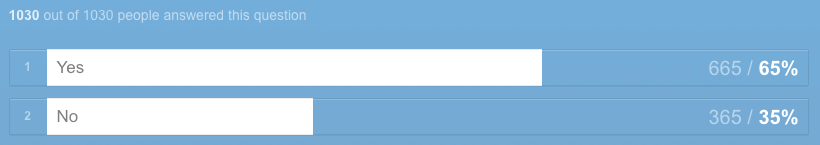
Q: If yes, what types of employee recognition programs have you used?
Give employees quarterly recognition and you'll satisify 56% of the workforce.
Q: How often do you wish you were recognized for your contributions?

Employee Recognition Report methodology
The report was conducted using Mechanical Turk in the Summer of 2018. 1030 participants answered most questions.
Participant demographics
- 52% were female, 48% male
- 8% were 18-24, 33% were 25-34, 24% 35-44, 19% 45-54, 12% 55-64 years of age.
- Although allowed internationally, 84% were in the USA and 10% in India. Canada and Mexico made up 1% each.
- One major problem was the percentage of caucasians in the study: 70% white, 10% South Asian, 6% black, 4% Hispanic, Latino or Spanish origin, 4$ East Asian.
- 49% were married, 30% single, 9% living with their partner, 9% divorced, 2% separated.
- On average people live with 2.99 people.
- 76% drive for transportation, 8% walk, 6% bike, 5% motorcycle, 3% bus, 2% metro, 1% train. One person said they travel by plane.
- 45% have a bachelor's degree, 15% attended college, 14% associate degree, 13% Master's degree, 8% high school, 3% professional degree, 1% doctorate degree.
- 18% technology, 10% work in health care, 8% financial services, 6% retail, 5% accounting, 5% education, and more across 102 industries.
- 22% make $50k to $75k, 18% $30k to $40k, 18% under $20k, 13% $75k to $100k, 10% $20k to $30k.